
- ~171,000Outdoor business locationsUnited States and Canada
- ~$412BAnnual merchant revenueModeled central case
- ~$266BAnnual electronic payment volume~65% blended electronic share
- ~1.47BAnnual electronic transactionsAcross all ten industries
- ~$181Blended electronic transactionModeled average
Fizel Research estimates, 2026
The outdoor economy is enormous, but surprisingly difficult to count.
Government agencies and industry organizations regularly measure outdoor recreation through participation, consumer spending, employment and economic contribution. Those measures tell us how important outdoor recreation is to the broader economy. They don't necessarily tell us how many businesses actually make that economy work.
A ski shop in Colorado, a fishing guide in British Columbia, a campground in Montana, a marina in Ontario, a rafting operator in Idaho and a powersports dealership in Alberta all participate in the outdoor economy, but they often appear in completely different statistical classifications. Some are retailers. Some are accommodation. Some are transportation. Many are simply absorbed into broad service categories that say nothing about the outdoors.
Fizel Research set out to build a merchant-level view.
Our 2026 central-case model estimates that approximately 171,000 outdoor-focused business locations operate across the United States and Canada, generating approximately $412 billion in annual merchant revenue. We estimate roughly $266 billion of that commerce flows through electronic payments each year.
These figures are not intended to represent an official census of the outdoor economy. They are Fizel Research estimates designed to provide a practical view of the businesses that sell outdoor products, experiences, accommodation, recreation and related services.
The outdoor business economy at a glance
Ten primary industries, modeled by location count, merchant revenue and electronic payment volume.
The model is organized around the ten primary industries Fizel serves. Each business is assigned to a single primary category based on its dominant economic activity, which keeps a ski shop that also rents equipment from being counted twice.
| Industry | Est. locations | Est. annual revenue | Est. electronic payment volume |
|---|---|---|---|
| Retail & Service | ~39,000 | ~$66B | ~$52B |
| Guides & Outfitters | ~22,000 | ~$11B | ~$8B |
| Adventure Travel & Tours | ~14,000 | ~$15B | ~$12B |
| Resorts & Destinations | ~7,000 | ~$45B | ~$32B |
| Campgrounds & Accommodations | ~19,000 | ~$24B | ~$18B |
| Marine & Marinas | ~10,000 | ~$27B | ~$18B |
| Rentals | ~11,000 | ~$10B | ~$8B |
| Events & Recreation | ~24,000 | ~$43B | ~$31B |
| Powersports | ~12,000 | ~$99B | ~$55B |
| Outdoor Brands & Manufacturers | ~13,000 | ~$72B | ~$32B |
| Total | ~171,000 | ~$412B | ~$266B |
Modeled central case for the United States and Canada combined, 2026.
Modeled estimates. Not official government establishment counts.
Source: Fizel Research 2026 model
Establishment counts across the ten primary Fizel industries.
- Retail & Service~39,000
- Events & Recreation~24,000
- Guides & Outfitters~22,000
- Campgrounds & Accommodations~19,000
- Adventure Travel & Tours~14,000
- Outdoor Brands & Manufacturers~13,000
- Powersports~12,000
- Rentals~11,000
- Marine & Marinas~10,000
- Resorts & Destinations~7,000
Estimated business locations (thousands)
Source: Fizel Research 2026 model. Figures rounded to the nearest thousand.
What are those 171,000 businesses?
A merchant-level map of the outdoor economy, category by category.
Totals are useful. Recognizable businesses are more useful. The following market map breaks each of the ten primary industries into the merchant types an operator would actually recognize: bike shops, fishing guides, campgrounds, marinas, golf facilities, powersports dealers. Each merchant type is a modeled estimate, and each set rolls up to its primary industry total.
Retail & Service: ~39,000 locations
Specialty retail is the most visible face of the outdoor economy and, in our model, its largest category by establishment count. It includes outdoor and sporting goods retailers, bike shops, ski and snowboard shops, fly shops, run specialty stores, surf shops and the service benches attached to most of them.
| Merchant type | Est. North American locations |
|---|---|
| Outdoor / sporting goods specialty retailers | ~11,500 |
| Bike shops | ~8,500 |
| Fishing & fly shops | ~4,000 |
| Ski & snowboard shops | ~3,500 |
| Running / trail specialty stores | ~3,000 |
| Surf shops | ~2,000 |
| Paddlesports / kayak specialty retailers | ~1,500 |
| Climbing / mountaineering specialty retailers | ~1,000 |
| Outdoor repair / service businesses and other specialty merchants | ~4,000 |
| Estimated total | ~39,000 |
Each establishment is assigned to a single primary merchant category.
Source: Fizel Research 2026 model
In the real world these categories overlap constantly. A mountain-town shop may sell bikes in summer, skis in winter, climbing hardware year-round and run a service bench through all of it. To reduce double counting, the model assigns each establishment to its primary merchant category rather than counting it in every department it operates.
Guides & Outfitters: ~22,000 operators
This is the hardest category in the model to measure. Most guides and outfitters are small owner-operated businesses, many operate seasonally, and statistical classifications vary widely by state, province and permitting authority. The numbers below should be read as modeled estimates rather than a register of licensed operators.
| Merchant type | Est. locations / operators |
|---|---|
| Fishing guides & outfitters | ~8,000 |
| Hunting outfitters | ~4,500 |
| Hiking / backpacking / wilderness guides | ~2,500 |
| Climbing & mountaineering guides | ~1,500 |
| Paddling / canoe / kayak guides | ~2,000 |
| Ski / backcountry / snow guides | ~1,000 |
| Multi-activity and other outdoor guides | ~2,500 |
| Estimated total | ~22,000 |
Source: Fizel Research 2026 model
Adventure Travel & Tours: ~14,000 operators
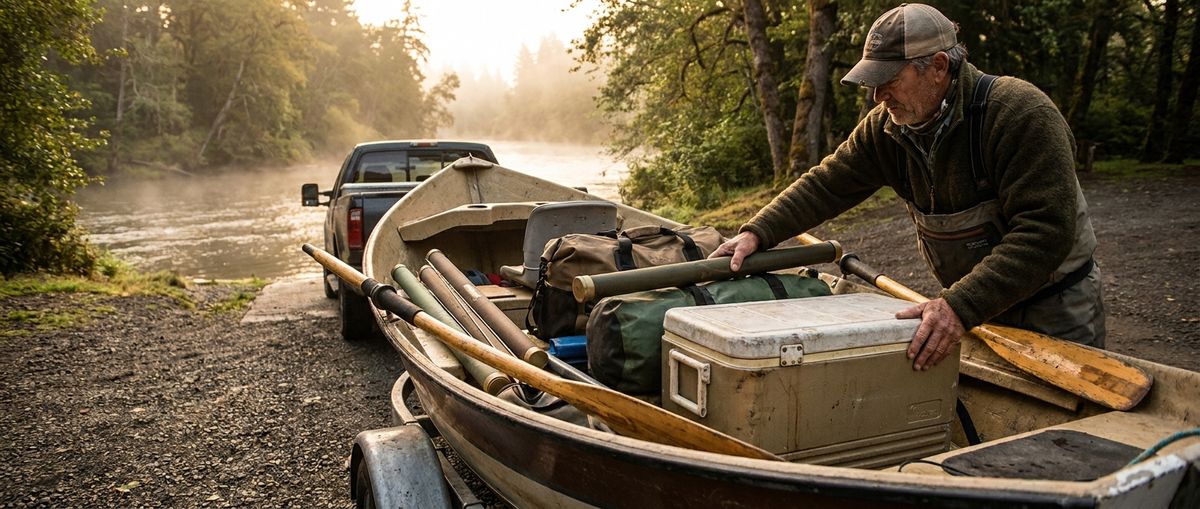
The model keeps guides and commercial tour operators conceptually distinct. A guide sells expertise and access, usually in small groups. A tour operator sells a scheduled, packaged, often multi-passenger product with reservations, deposits and departure calendars. Some businesses sit in both worlds; the model assigns them to whichever activity carries the majority of revenue.
| Merchant type | Est. operators |
|---|---|
| Fishing charters | ~4,000 |
| Rafting / whitewater operators | ~1,500 |
| Wildlife / nature / adventure tours | ~2,500 |
| Boat / sailing / marine tours | ~2,000 |
| Cycling / mountain-bike tour operators | ~1,000 |
| Zipline / aerial / adventure tour operators | ~1,000 |
| Multi-day and other adventure operators | ~2,000 |
| Estimated total | ~14,000 |
Source: Fizel Research 2026 model
Resorts & Destinations: ~7,000 locations
Resorts are the smallest category by count and one of the largest by revenue. A single four-season property can operate lodging, lift or activity ticketing, food and beverage, retail, rental, instruction and events, several distinct payment environments inside one business. In the model, a property counts once, even though it may run a dozen points of sale.
| Merchant type | Est. locations |
|---|---|
| Ski areas & ski resorts | ~650 |
| Mountain / four-season resorts | ~1,000 |
| Outdoor lodges / destination properties | ~2,500 |
| Golf / recreation resorts | ~1,000 |
| Adventure / destination recreation properties | ~1,850 |
| Estimated total | ~7,000 |
Source: Fizel Research 2026 model
Campgrounds & Accommodations: ~19,000 locations
Public establishment data provides useful anchors here: both the U.S. Census Bureau and Statistics Canada publish establishment counts for RV parks and recreational camps, and campground industry associations publish their own directories. Those sources inform the model, but the ~19,000 figure is Fizel's own estimate of the campground, RV park and outdoor accommodation merchant universe, not a number published by any agency.
| Merchant type | Est. locations |
|---|---|
| Campgrounds | ~8,500 |
| RV parks / resorts | ~6,000 |
| Glamping operators | ~1,500 |
| Outdoor lodges / cabins / wilderness accommodations | ~3,000 |
| Estimated total | ~19,000 |
Source: Fizel Research 2026 model
Marine & Marinas: ~10,000 locations
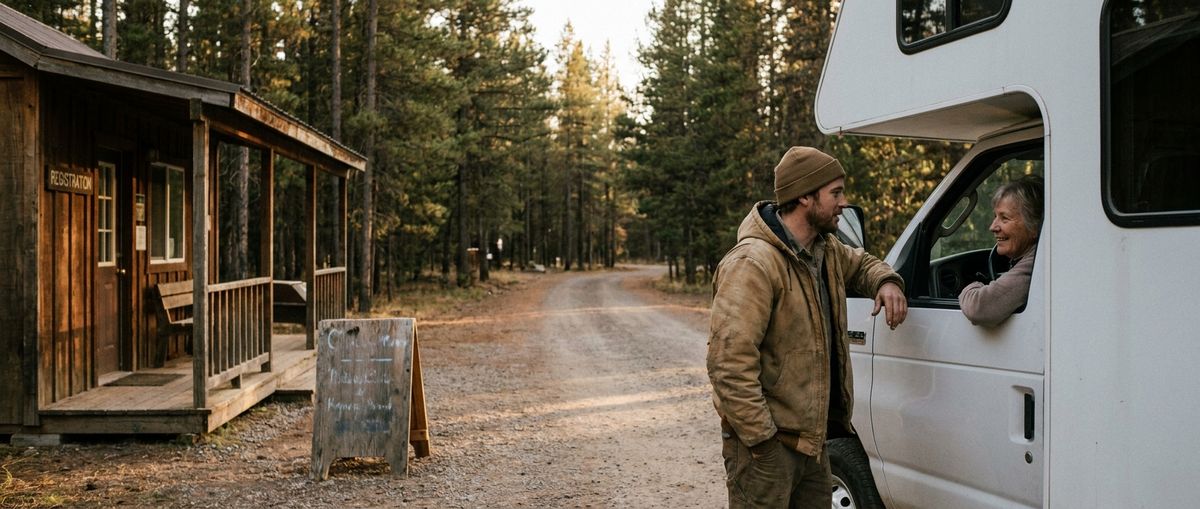
This category is deliberately scoped to recreational marine facilities: marinas, boatyards, service operations, storage and fuel. Boat dealers whose primary activity is unit sales are modeled under Powersports, and charter and sailing-tour businesses are modeled under Adventure Travel & Tours, so the same dock doesn't get counted three times.
| Merchant type | Est. locations |
|---|---|
| Recreational marinas | ~6,500 |
| Boatyards / marine service operations | ~2,000 |
| Other recreational marine facilities | ~1,500 |
| Estimated total | ~10,000 |
Source: Fizel Research 2026 model
Rentals: ~11,000 operators
Almost every category in this report rents something. Ski shops rent skis, resorts rent bikes, tour operators rent boats. To avoid double counting, this category represents businesses where rental is the primary business activity or where rental runs as a distinct location. Rental departments inside retailers and resorts are counted within those businesses.
| Merchant type | Est. operators / locations |
|---|---|
| Bike rentals | ~2,500 |
| Ski / snowboard rentals | ~2,000 |
| Kayak / SUP / paddlesports rentals | ~2,000 |
| Boat rentals | ~2,000 |
| General outdoor equipment rentals | ~1,500 |
| Other specialty outdoor rentals | ~1,000 |
| Estimated total | ~11,000 |
Source: Fizel Research 2026 model
Events & Recreation: ~24,000 locations
Golf dominates this category. Authoritative facility counts published by the National Golf Foundation and Canadian golf industry sources are the anchor for the modeled golf facility estimate below, which in turn makes Events & Recreation the second-largest category by establishment count. Climbing gyms, aerial parks, recreation facilities and endurance event operators make up the balance.
| Merchant type | Est. locations |
|---|---|
| Golf courses / facilities | ~16,000 |
| Climbing gyms | ~1,000 |
| Adventure / aerial parks | ~1,000 |
| Outdoor recreation facilities | ~2,500 |
| Race / endurance / recreation event operators | ~1,500 |
| Other outdoor recreation operators | ~2,000 |
| Estimated total | ~24,000 |
Source: Fizel Research 2026 model
Powersports: ~12,000 locations
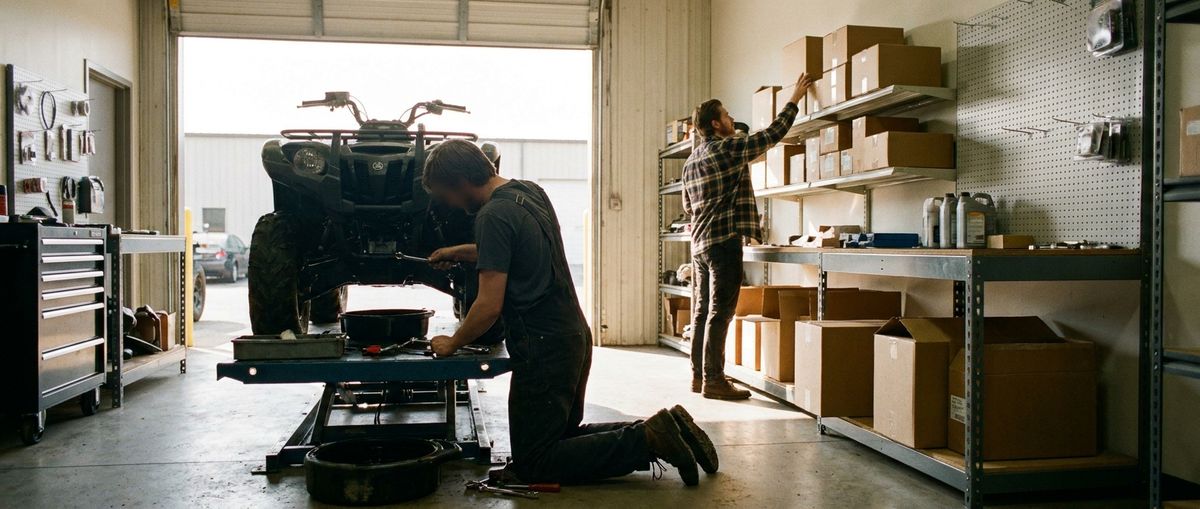
Most powersports dealerships carry several vehicle categories and run parts, accessories and service departments alongside unit sales. The model classifies each dealership by its primary business orientation rather than by every franchise on the sign, which keeps a multi-line store from appearing in four rows at once.
| Merchant type | Est. locations |
|---|---|
| Multi-line powersports dealers | ~5,000 |
| Motorcycle-focused dealers | ~2,500 |
| ATV / UTV-focused dealers | ~1,500 |
| Snowmobile-focused dealers | ~750 |
| PWC / recreational watercraft dealers | ~750 |
| Powersports rentals / specialty operations | ~1,500 |
| Estimated total | ~12,000 |
Source: Fizel Research 2026 model
Outdoor Brands & Manufacturers: ~13,000 companies
This category mixes manufacturers, product companies and outdoor brands selling through wholesale, dealer, retail and direct-to-consumer channels. It is the category where a single business most often operates several payment models simultaneously: B2B invoicing to dealers, DTC ecommerce, showroom or factory-store retail and event sales.
| Merchant type | Est. companies / locations |
|---|---|
| Outdoor equipment / gear brands | ~3,000 |
| Outdoor apparel / footwear brands | ~2,500 |
| Cycling brands / manufacturers | ~1,500 |
| Fishing / hunting product brands | ~2,000 |
| Watersports / marine recreation brands | ~1,000 |
| Winter sports brands | ~750 |
| Other outdoor product manufacturers / brands | ~2,250 |
| Estimated total | ~13,000 |
Source: Fizel Research 2026 model
Reconciliation: the merchant-type estimates in this section roll up to the ten primary industry totals, which sum to approximately 171,000 outdoor business locations and operators across the United States and Canada. Small differences reflect rounding. Source: Fizel Research 2026 model.
Counts don't equal economics
Modeled revenue per location, electronic payment share and transaction size by industry.
Business counts describe the shape of an industry. They say very little about its economic weight. Guides & Outfitters contain roughly twice as many businesses as Powersports in our model, and roughly one-ninth of the revenue. The table below shows the modeled average annual merchant revenue per location that sits behind the market model.
| Industry | Modeled avg. annual revenue / location |
|---|---|
| Retail & Service | ~$1.7M |
| Guides & Outfitters | ~$0.5M |
| Adventure Travel & Tours | ~$1.1M |
| Resorts & Destinations | ~$6.4M |
| Campgrounds & Accommodations | ~$1.3M |
| Marine & Marinas | ~$2.7M |
| Rentals | ~$0.9M |
| Events & Recreation | ~$1.8M |
| Powersports | ~$8.3M |
| Outdoor Brands & Manufacturers | ~$5.5M |
Broad market-model averages, not a description of any typical individual merchant.
Source: Fizel Research 2026 model
These are market averages, and business-size distributions in the outdoor economy are heavily skewed. A single destination resort or multi-location dealer group can carry more revenue than several hundred owner-operated guide businesses combined. A one-boat charter captain and a four-season resort should never be read through the same revenue profile, even when they appear one row apart in a table.
Where the electronic volume is
An estimated $266 billion moves through electronic payments each year, unevenly.
Not every dollar of outdoor merchant revenue moves through a card, wallet or online payment. The model applies a distinct electronic payment share to each industry, reflecting how that industry actually collects money.
| Industry | Est. merchant revenue | Modeled electronic share | Est. electronic payment volume |
|---|---|---|---|
| Retail & Service | $66B | ~79% | ~$52B |
| Guides & Outfitters | $11B | ~73% | ~$8B |
| Adventure Travel & Tours | $15B | ~80% | ~$12B |
| Resorts & Destinations | $45B | ~71% | ~$32B |
| Campgrounds & Accommodations | $24B | ~75% | ~$18B |
| Marine & Marinas | $27B | ~67% | ~$18B |
| Rentals | $10B | ~80% | ~$8B |
| Events & Recreation | $43B | ~72% | ~$31B |
| Powersports | $99B | ~56% | ~$55B |
| Outdoor Brands & Manufacturers | $72B | ~44% | ~$32B |
| Total | ~$412B | ~65% blended | ~$266B |
Electronic shares are Fizel modeling assumptions, not published payment-network statistics.
Source: Fizel Research 2026 model
How the modeled $266B of annual electronic volume distributes across the ten industries.
- Powersports~$55B
- Retail & Service~$52B
- Resorts & Destinations~$32B
- Outdoor Brands & Manufacturers~$32B
- Events & Recreation~$31B
- Campgrounds & Accommodations~$18B
- Marine & Marinas~$18B
- Adventure Travel & Tours~$12B
- Guides & Outfitters~$8B
- Rentals~$8B
Estimated annual electronic payment volume (US$ billions)
Source: Fizel Research 2026 model. Modeled estimates, rounded.
From a $40 accessory to a $10,000 repair bill
The outdoor economy has an unusually broad transaction spectrum.
Few sectors ask a single payment environment to handle a $40 accessory at a counter, a $600 guided day, a $4,000 seasonal slip contract and a five-figure repair invoice. The modeled averages below are category-level assumptions used to convert electronic volume into transaction counts.
| Industry | Modeled average electronic transaction |
|---|---|
| Retail & Service | ~$115 |
| Guides & Outfitters | ~$425 |
| Adventure Travel & Tours | ~$550 |
| Resorts & Destinations | ~$260 |
| Campgrounds & Accommodations | ~$210 |
| Marine & Marinas | ~$475 |
| Rentals | ~$125 |
| Events & Recreation | ~$140 |
| Powersports | ~$625 |
| Outdoor Brands & Manufacturers | ~$275 |
| Blended, all industries | ~$181 |
Directional category-level modeling assumptions, not observed processing averages.
Source: Fizel Research 2026 model
One clarification matters. The modeled ~$625 average for Powersports is not the price of a vehicle. It is the average of an electronic payment mix that includes deposits, parts, accessories, apparel, service work and partial payments alongside unit purchases. The same logic applies elsewhere: resort averages blend lift or activity tickets with lodging folios, and marina averages blend a bag of ice with a haul-out invoice.
The spread between a counter sale and a booked experience is the defining payment characteristic of the outdoor economy.
- Powersports~$625
- Adventure Travel & Tours~$550
- Marine & Marinas~$475
- Guides & Outfitters~$425
- Outdoor Brands & Manufacturers~$275
- Resorts & Destinations~$260
- Campgrounds & Accommodations~$210
- Events & Recreation~$140
- Rentals~$125
- Retail & Service~$115
Modeled average electronic transaction (US$)
Source: Fizel Research 2026 model. Blended modeled average across all industries: ~$181.
United States and Canada
A directional split of the modeled merchant universe.
Directional Fizel Research estimates. Not an official national business count, and deliberately presented without state or provincial precision the model cannot support.
- ~$367B modeled annual merchant revenue
- Roughly 88% of modeled North American outdoor business locations
- Depth in specialty retail, golf, powersports and destination resorts
- ~$45B modeled annual merchant revenue
- Roughly 12% of modeled North American outdoor business locations
- Weighted toward guides, outfitters, marine, campgrounds and snow
- ~$412B modeled annual merchant revenue
- ~$266B modeled annual electronic payment volume
- ~1.47B modeled annual electronic transactions
Source: Fizel Research 2026 model
- United States~151,000
- Canada~20,000
Estimated outdoor business locations (thousands)
Source: Fizel Research 2026 model. Directional split; not an official national business count.
The two markets are not simply scaled versions of each other. Canada's modeled merchant base leans more heavily toward guiding, outfitting, marine and seasonal accommodation, while the U.S. carries a deeper specialty retail and golf facility base. For operators and brands working on both sides of the border, the practical consequence is cross-border card acceptance, multi-currency pricing and settlement in two banking systems.
The industries with the most businesses are not the industries with the largest payment volumes.
| Industry | Share of modeled locations | Share of modeled electronic volume | Gap |
|---|---|---|---|
| Retail & Service | ~23% | ~20% | −3 pts |
| Events & Recreation | ~14% | ~12% | −2 pts |
| Guides & Outfitters | ~13% | ~3% | −10 pts |
| Campgrounds & Accommodations | ~11% | ~7% | −4 pts |
| Adventure Travel & Tours | ~8% | ~4% | −4 pts |
| Outdoor Brands & Manufacturers | ~8% | ~12% | +4 pts |
| Powersports | ~7% | ~21% | +14 pts |
| Rentals | ~6% | ~3% | −3 pts |
| Marine & Marinas | ~6% | ~7% | +1 pt |
| Resorts & Destinations | ~4% | ~12% | +8 pts |
Shares derived from the modeled location counts and electronic volumes in this report; percentages rounded.
Source: Fizel Research 2026 model
Six findings from the model
Observations that emerge from the 2026 central case.
An estimated ~39,000 specialty retail and service locations make Retail & Service the largest Fizel merchant category by establishment count, spread across thousands of independent operators rather than concentrated in a handful of chains.
Golf facilities account for roughly two-thirds of the modeled Events & Recreation business universe, which makes golf one of the largest single merchant types in the entire outdoor-economy model.
Powersports represents only about 7% of modeled outdoor-business locations but approximately $55B of electronic payment volume, the largest single share of modeled electronic volume in the report.
Guides & Outfitters represent an estimated ~22,000 operators, yet modeled revenue per business is roughly $0.5M, a fraction of the profile modeled for resorts, powersports dealers or manufacturers.
Retail & Service accounts for less than a quarter of modeled outdoor-business locations. The rest is experiences, destinations, accommodation, recreation, marine, rentals and services.
Two outdoor businesses can both generate $2M of revenue and still need very different payment environments, depending on transaction size, seasonality, ecommerce, reservations, deposits and recurring revenue.
How Fizel estimated the outdoor business economy
Methodology, assumptions and the limits of the model.
There is no single NAICS code, government dataset or industry registry that contains every outdoor business in North America. Outdoor merchants are distributed across retail, accommodation, arts and recreation, transportation, manufacturing, wholesale and personal services classifications, and many of those classifications include businesses with no connection to the outdoors at all.
The model is therefore built bottom-up, one merchant category at a time, and then reconciled to the ten primary industries.
The largest methodological challenge is that outdoor businesses cross categories constantly. A ski shop may also operate rentals. A resort may run lodging, retail and rentals. A marina may include storage, service and a retail counter. A guide may also operate packaged tours. An outdoor brand may operate its own direct-to-consumer store. Wherever practical, the model assigns each business to a single primary economic activity to reduce double counting, which means a category total describes businesses of that type rather than every business that performs that activity.
The resulting figures should be interpreted as central-case market estimates rather than an official census. Where public establishment counts exist, as they do for RV parks, golf facilities, marinas and ski areas, they anchor the relevant category. Where they do not exist, as with most guiding and outfitting businesses, the estimate carries a wider band of uncertainty and should be treated accordingly.
Fizel Research expects to refine this model as better industry data becomes available, and to publish revisions rather than quietly restate them.
Last updated: August 2026. Source: Fizel Research 2026 model.
Sources
The following public and industry sources inform the assumptions in this model. They provide establishment counts, economic context and category benchmarks. They do not publish the totals presented in this article, which are Fizel Research calculations and estimates.
- U.S. Bureau of Economic Analysis, Outdoor Recreation Satellite Account
- U.S. Census Bureau, County Business Patterns and Economic Census establishment data
- Statistics Canada, Canadian Business Counts and tourism satellite account data
- National, state and provincial tourism and outdoor recreation datasets
- National Golf Foundation golf facility counts
- Campground and RV industry associations and published park directories
- Marina and recreational boating associations and industry reporting
- Powersports industry organizations and dealer-network reporting
- Outdoor recreation and specialty trade associations
- Public company filings and category-specific industry benchmarks
- Fizel Research merchant-category modeling, 2026