
Executive Summary
Outdoor has become a mainstream economy, and its next phase depends less on new participants than on how often the existing ones go outside.
Outdoor recreation ended 2025 with a larger participant base than at any previous point measured in the United States. 183.2 million Americans participated, representing 59% of the population age six and older. Participation still grew, but at only 1.1%, while the average participant took roughly five fewer outdoor outings than in 2019.
That combination, more participants, but lower frequency, may be the single most important structural change facing the outdoor industry.
- $785BNorth American outdoor recreation value added, 2025Fizel Research estimate
- 183.2MU.S. outdoor participants, 2025Outdoor Industry Association, reported
- 59.0%Share of the U.S. population age 6+ participatingOutdoor Industry Association, reported
- $54.0BU.S. recreational marine spending, 2025National Marine Manufacturers Association, reported
- $1.01TNorth American outdoor value added, 2030 base caseFizel Research estimate
The commercial side is equally large. U.S. outdoor recreation generated $696.7 billion of value added in 2024, equivalent to 2.4% of national GDP. Retail trade contributed $169.1 billion, recreation, accommodation and food services contributed $174.4 billion, and manufacturing contributed a further $91.3 billion.
| Indicator | Value | Basis |
|---|---|---|
| North American outdoor recreation value added, 2025 | $785B | Fizel estimate |
| U.S. outdoor recreation value added, 2025 | $729B | Fizel estimate |
| U.S. outdoor recreation value added, 2024 | $696.7B | Reported (BEA) |
| U.S. outdoor participants, 2025 | 183.2M | Reported (OIA) |
| Share of U.S. population age 6+ participating | 59.0% | Reported (OIA) |
| U.S. outdoor product retail market, 2025 | $27.7B | Fizel estimate |
| U.S. recreational marine spending, 2025 | $54.0B | Reported (NMMA) |
| Americans who bicycled, 2024 | 112M | Reported (PeopleForBikes) |
| Canadian skiing facility operating revenue, 2024 | C$1.4B | Reported (Statistics Canada) |
Every modeled figure in this report is labelled as a Fizel estimate. Reported figures are attributed to their published source and data year.
Sources: U.S. Bureau of Economic Analysis; Outdoor Industry Association; NMMA; PeopleForBikes; Statistics Canada; Fizel Research.
Participation now reaches nearly three in five Americans age six and older. Awareness is no longer the constraint.
The market has successfully added participants. The next challenge is getting those participants outside more often.
Travel, lodging, food, rentals, guides, resorts, marinas and experiences represent an enormous share of outdoor economic activity.
Broader participation has shifted product demand toward accessible, versatile and lifestyle-oriented categories.
Customers discover online, reserve on a phone, pay a deposit remotely, check in at a counter and buy again during or after the experience.
The Scale Of The Outdoor Economy
A $785 billion North American economy that is far bigger than the gear market it is usually measured by.
The outdoor economy is often described through equipment sales or participation statistics. Neither captures its full footprint. Value is generated through the products people buy, the destinations they visit, where they stay, the services they use, the equipment they rent, the vehicles and boats they purchase, and the businesses that support each activity.
In 2024, the U.S. outdoor recreation economy generated $696.7 billion of value added, 2.4% of U.S. GDP. Real outdoor-recreation GDP grew 2.7% during the year.
| Market | 2024 | 2025E | YoY |
|---|---|---|---|
| United States | $696.7B | $729B | +4.6% |
| Canada | $52B E | $56B E | +7.7% |
| North America | $749B E | $785B E | +4.8% |
The 2025 figure is economic value added, not consumer sales. Canadian value added is modeled from national economic output, recreation-sector data and comparable U.S. outdoor-economy intensity.
Sources: BEA (2024 U.S. reported); Fizel Research estimates for all figures marked E.
- Recreation, accommodation & food services$174.4B · 25.0%
- Retail trade$169.1B · 24.3%
- Manufacturing$91.3B · 13.1%
- Other supporting industries$261.9B · 37.6%
Nearly half of outdoor value added comes from retail plus recreation, accommodation and food services.
Source: U.S. Bureau of Economic Analysis, Outdoor Recreation Satellite Account, 2024.
The outdoor economy is therefore not principally a gear market. It is a commerce ecosystem built around products, places and experiences, and the places and experiences are now the larger half.
Participation At Mass Scale
183.2 million participants, and the slowest growth rate in years.
Outdoor participation in the United States reached 183.2 million people in 2025, 59% of the population age six and older. Participation increased 1.1% year over year, the smallest annual increase in the recent expansion. The market added participants faster than the population grew, but only slightly.

| Year | Participants | Participation rate | YoY growth |
|---|---|---|---|
| 2019 | 153.0M | 50.7% | N/A |
| 2021 | 164.2M | 54.0% | +3.6% |
| 2023 | 175.8M | 57.3% | +4.1% |
| 2024 | 181.1M | 58.3% | +3.0% |
| 2025 | 183.2M | 59.0% | +1.1% |
Growth has slowed from post-2020 highs, but the base is structurally larger than the pre-2020 market.
Sources: Outdoor Industry Association participation reporting; Fizel Research analysis.
Two implications follow. First, the addressable market for outdoor businesses is now genuinely mainstream: nearly three in five Americans engage with the outdoors in some form. Second, the era of easy participant growth has ended. Businesses that built their plans on a rising tide of first-timers will need a different engine.
The Frequency Gap
More people are going outside, less often. This is the defining commercial problem of the decade.
The participant base expanded by roughly 30 million people since 2019. Over the same period, average outings per participant fell by approximately five per year. The industry gained participants and lost occasions.
Frequency, not headcount, is now the largest lever in the outdoor economy. The arithmetic is unusually simple.
- 183.2M participants
- × 1 additional outing per year
- = 183.2M additional outdoor occasions
= One extra outing per participant ≈ 183 million new commercial occasions
Illustrative model. Closing even part of the frequency gap creates more incremental outdoor occasions than several years of participant growth at the current 1.1% rate.
By comparison, a 1.1% increase in participants adds roughly two million people. Even if each of those new participants went out ten times, the total contribution would be a fraction of what a single additional outing per existing participant would produce.
Frequency responds to operational design more than to marketing spend.
Time, planning effort, gear readiness, weather uncertainty and cost per occasion suppress repeat participation more than lack of interest.
Rentals, memberships, lessons, guided trips, tune-ups and stored payment credentials all reduce the effort of the next occasion.
Businesses that convert a first visit into a season pass, a stored card, a booking account or a service relationship compound frequency.
The Outdoor Consumer Has Changed
The average outdoor customer in 2026 is more casual, more urban and more value-conscious than the customer the industry was built for.
As participation broadened, the composition of the participant base changed. Growth has come disproportionately from people who participate occasionally, close to home, in low-barrier activities: walking, hiking, day-use paddling, casual cycling, car camping and short-duration trips.
This consumer buys differently. They favour versatile products over specialised ones, expect the same digital convenience they receive from mainstream retail, are more likely to rent before they buy, and are more sensitive to total cost per occasion than to brand heritage.
| Dimension | Traditional core participant | Emerging majority participant |
|---|---|---|
| Frequency | Weekly or better | A few times per season |
| Trip length | Multi-day | Half-day or day trip |
| Gear approach | Owns specialised kit | Rents, borrows or buys versatile |
| Discovery | Community and shops | Search, social and marketplaces |
| Booking | Phone or walk-in | Mobile, ahead of arrival |
| Price posture | Invests in performance | Weighs cost per occasion |
Directional profile based on participation composition, category mix and consumer-behaviour indicators.
Source: Fizel Research analysis.
Fizel estimate. Segment profiles are directional and derived from participation composition data rather than a single survey instrument.
Outdoor Retail
A $27.7 billion U.S. product market being reshaped by casual demand, discounting and resale.
Fizel Research estimates the U.S. outdoor product retail market at approximately $27.7 billion in 2025 across apparel, footwear, equipment and accessories sold through specialty, outdoor chain, direct-to-consumer and online channels.
Retail conditions remained mixed. Broader participation increased unit demand in accessible categories while inventory normalisation and heavier promotional activity compressed margins in technical categories. The result is a market growing in volume faster than in value.
| Category | 2025E revenue | Share | Direction |
|---|---|---|---|
| Apparel | $9.4B | 34% | Volume up, price down |
| Equipment & hard goods | $8.6B | 31% | Flat to soft |
| Footwear | $6.1B | 22% | Growing |
| Accessories & consumables | $3.6B | 13% | Growing |
Category shares are Fizel estimates and are directional rather than audited channel data.
Source: Fizel Research estimates.
The Outdoor Commerce Map
The outdoor customer moves through five commercial moments, most operators only monetize two of them.
Outdoor spending does not occur at a single point of sale. It is distributed across a journey that starts online, moves onto a phone, arrives at a physical counter and continues after the customer has gone home.
Five moments define outdoor commerce. Operators that only capture the transaction at the counter are monetising one of five.
- 01DiscoverSearch, social, maps and marketplaces, usually on a phone.
- 02ReserveBooking with a deposit taken days or weeks in advance.
- 03ArriveCheck-in, waivers, balance due, upgrades and add-ons.
- 04ExperienceOn-site retail, food, rentals, lessons and incidentals.
- 05ReturnService, resale, memberships and the next reservation.
Each stage is a distinct payment moment: a card-not-present deposit, an in-person balance, a tap at a counter, a stored credential for the next booking.
The commercial opportunity is concentrated at the edges of this journey. Deposits taken at reservation protect against no-shows and improve cash flow. Post-experience service, resale and rebooking convert one occasion into a relationship.
Cycling
112 million riders, an electrified product mix and a service economy that never leaves town.
Approximately 112 million Americans rode a bicycle in 2024, one of the largest participation figures in any outdoor activity. Cycling's commercial profile is unusual: it combines a high-value durable good, a recurring service requirement and an accessory attach rate that few outdoor categories match.

Electrification changed the economics. Higher average unit prices increase both financing relevance and service complexity, while the addressable rider base widens to include commuters and casual riders who would not have bought a traditional bicycle.
| Revenue line | Share of shop revenue | Margin profile | Frequency |
|---|---|---|---|
| New bicycle sales | 48% | Low to moderate | Every 3 to 7 years |
| Service & repair | 22% | High | 1 to 4 times per year |
| Parts & accessories | 20% | Moderate to high | Ongoing |
| Rental & demo | 6% | High | Seasonal |
| Used & trade-in | 4% | Moderate | Growing |
Revenue mix is a Fizel estimate for a representative independent cycling retailer, not an industry aggregate.
Sources: PeopleForBikes (participation, reported); Fizel Research estimates.
Marine
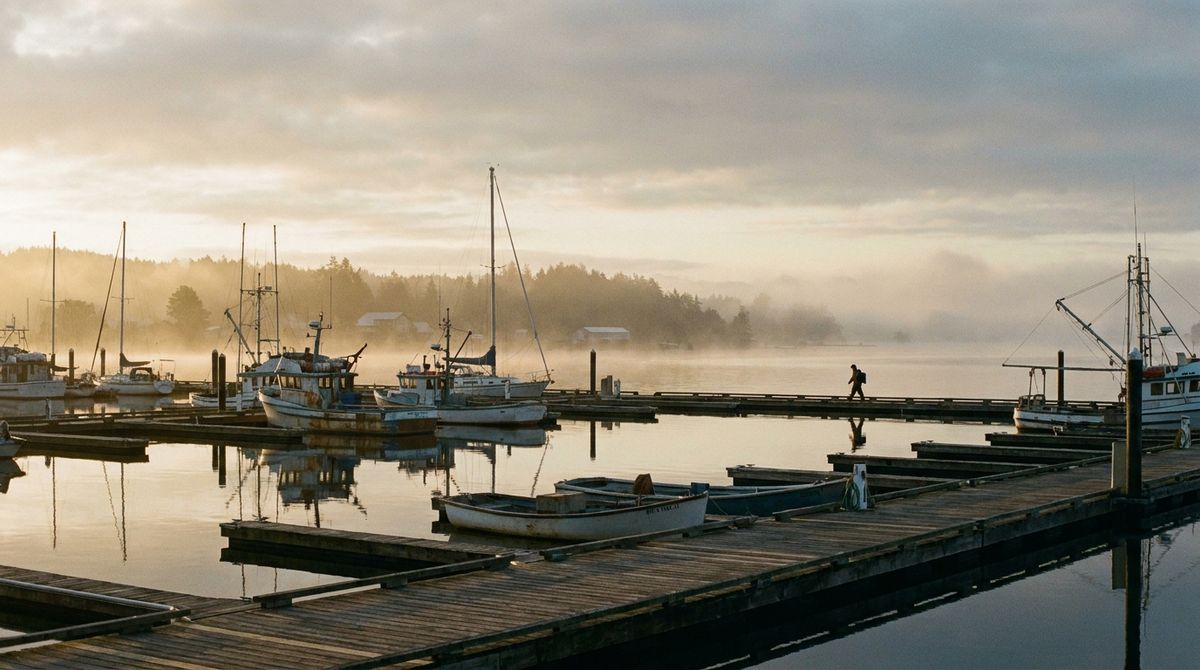
$54 billion of spending, the highest-value transactions in the outdoor economy, and a service relationship measured in decades.
U.S. recreational marine spending reached $54.0 billion in 2025. Marine is the outdoor economy's highest-ticket segment: boats, motors, trailers, slips, storage, insurance, service and fuel combine into a customer relationship with unusually high lifetime value.
| Component | 2025E | Payment characteristic |
|---|---|---|
| New and pre-owned boat sales | $28.0B | High ticket, often financed |
| Service, parts and accessories | $12.5B | Recurring, deposit-driven |
| Slips, storage and winterisation | $8.0B | Contracted and seasonal |
| Rentals, charters and clubs | $5.5B | Deposits and damage holds |
Component shares are Fizel estimates within the reported $54.0B total.
Sources: NMMA (total spending, reported); Fizel Research estimates for component split.
Camping, RVs And The Outdoor Stay
The outdoor stay has become the outdoor economy's most reliable recurring-revenue business.
Camping has broadened from tents into a spectrum that runs through car camping, RV travel, cabins, glamping and short-stay outdoor lodging. That spectrum has turned a low-cost activity into a lodging category with reservation systems, occupancy management, deposits and add-on revenue.
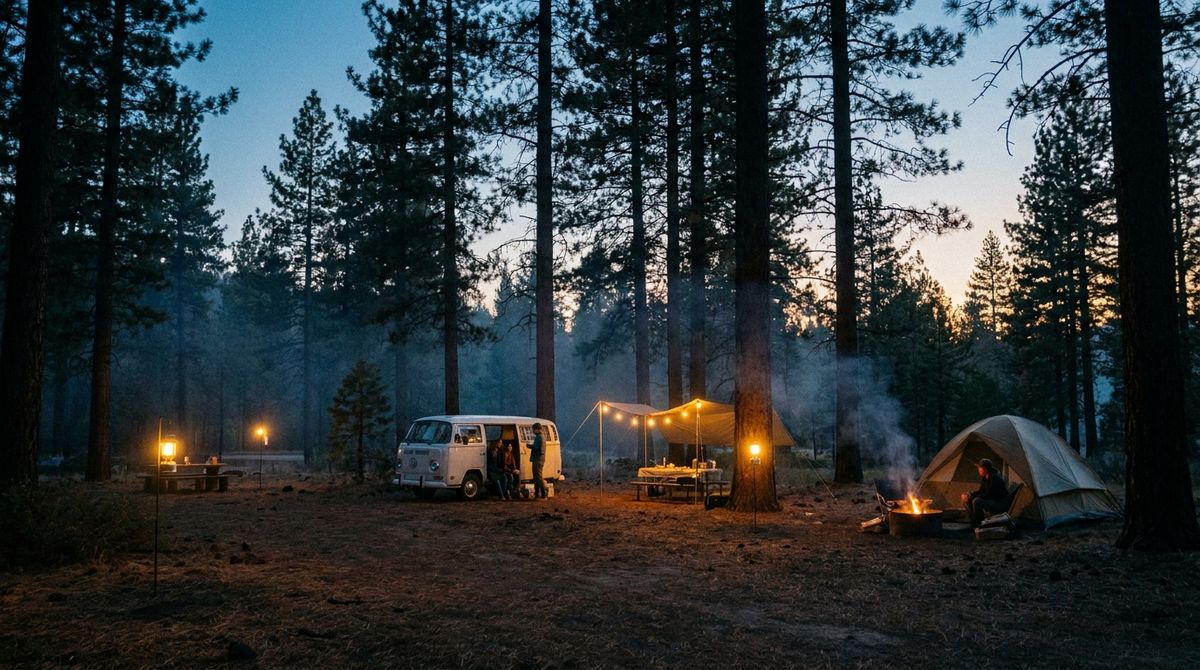
Reservations are made weeks ahead on a phone, with a deposit held against a card the operator never sees in person.
Firewood, ice, propane, rentals, camp store purchases and late checkout materially raise revenue per site night.
Seasonal sites, annual passes and repeat summer bookings turn a single stay into predictable annual revenue.
Snow
A compressed, weather-dependent season where a handful of weekends decide the year.
Canadian skiing facilities generated C$1.4 billion of operating revenue in 2024. Across North America, snow remains one of the most concentrated commercial calendars in the outdoor economy: the majority of annual revenue is earned in roughly one hundred operating days.
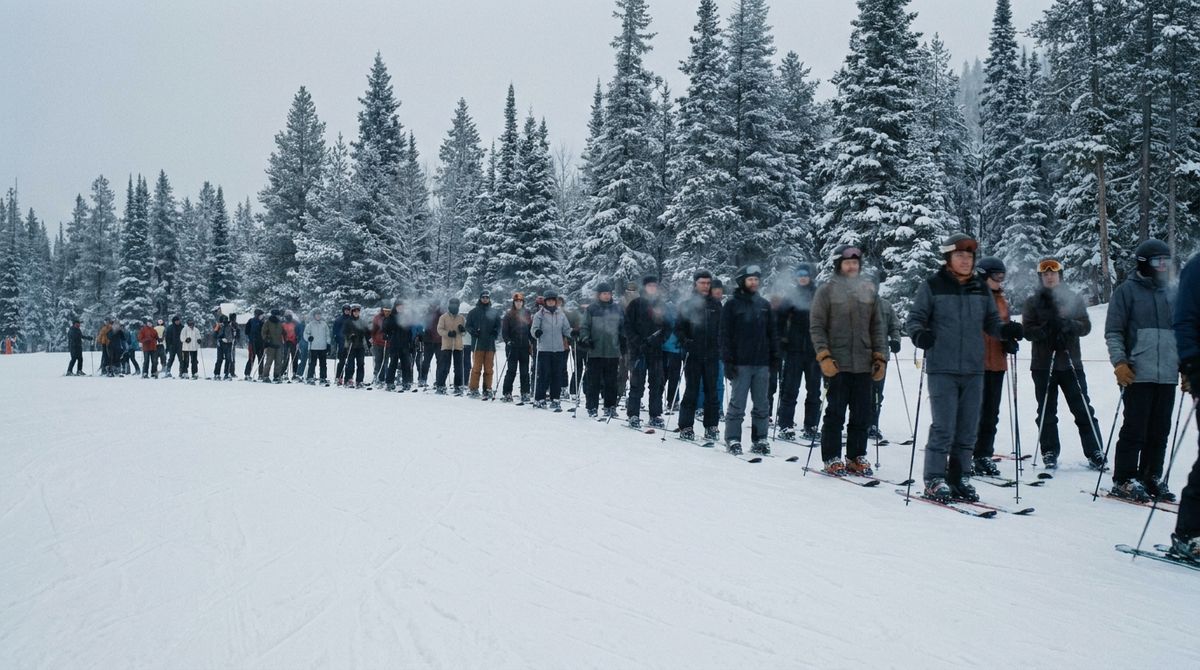
The industry's response has been to shift revenue earlier and make it less weather-sensitive: season passes sold in spring, multi-resort products, prepaid lessons and rentals, and stored credentials that make each subsequent visit frictionless.
| Revenue line | Share of season | Timing |
|---|---|---|
| Passes and lift tickets | 52% | Pre-season and in-season |
| Food, beverage and lodging | 23% | In-season |
| Rental and retail | 15% | In-season |
| Lessons and programs | 10% | Booked ahead |
Illustrative mix for a mid-sized North American resort. Reported anchor: Statistics Canada skiing facility operating revenue, C$1.4B (2024).
Sources: Statistics Canada (reported); Fizel Research estimates.
Experiences Versus Products
Spending is shifting from what people own to what people do.
Recreation, accommodation and food services contributed $174.4 billion of U.S. outdoor value added in 2024, exceeding retail trade at $169.1 billion. For the first time in the satellite-account era, the experience side of the outdoor economy is larger than the product side.
| Attribute | Product businesses | Experience businesses |
|---|---|---|
| Revenue timing | At the point of sale | Deposit ahead, balance on arrival |
| Capacity | Inventory-limited | Time and headcount-limited |
| Cancellation exposure | Returns | No-shows, weather and refunds |
| Repeat driver | Product replacement cycle | Memberships, passes and rebooking |
| Payment mix | Mostly card present | Mixed present and not present |
Experience businesses charge before delivery, hold deposits, manage capacity and refund against policy: a fundamentally different commercial model than product retail.
Sources: BEA (2024 value added, reported); Fizel Research analysis.
Seasonality
Outdoor businesses do not earn evenly. They earn in bursts, and finance the rest of the year against them.
Seasonality is the defining operational characteristic of the outdoor economy. Summer operators typically earn the majority of annual revenue between May and September; snow operators earn theirs between December and March. Both then carry fixed costs through months of minimal revenue.
Indexed monthly revenue distribution for three representative outdoor operator types.
- Summer operator (guides, rentals, campgrounds)
- Snow operator (resorts, ski and board shops)
- Year-round outdoor retail
Index: 100 = peak month
Fizel estimate. Index values are modeled revenue distributions for representative operators, not audited results.
Source: Fizel Research estimates.
Commerce Beyond The Counter
The counter is now the last step in a sequence that began on a phone.
Outdoor customers increasingly complete the commercial decision before arriving. They compare options online, reserve on mobile, pay a deposit remotely and expect their balance, waiver and add-ons to be handled without repeating information at the counter.
Three payment environments, one customer, one relationship.
Deposits and prepayments taken days or weeks ahead of the visit: card-not-present, with their own authorization and dispute characteristics.
Balance due, upgrades, retail and food at a counter, on a trail, at a dock or from a handheld terminal with intermittent connectivity.
Service work, damage charges, resale, memberships and next-season bookings against a stored credential.
Operators that treat these as three unrelated systems accumulate reconciliation work, duplicate customer records and avoidable disputes. Operators that treat them as one payment relationship convert more, refund less and rebook faster.
The Value-Conscious Consumer
Value consciousness is not a downturn behaviour. It is the new default.
The broadened participant base is more price-aware than the traditional core. That shows up as heavier promotional sensitivity, strong resale and rental demand, longer replacement cycles and rising interest in repair over replacement.

| Behaviour | Commercial effect | Operator response |
|---|---|---|
| Rent before buying | Defers a sale, creates an occasion | Rental-to-own credit and deposits |
| Buy used | Lower ticket, higher frequency | Trade-in and consignment programs |
| Repair instead of replace | High-margin service revenue | Service scheduling and deposits |
| Wait for promotion | Margin compression | Membership and loyalty pricing |
Directional assessment of the four value-oriented behaviours most affecting outdoor merchants.
Source: Fizel Research analysis.
The Fizel Outdoor Commerce Index
A composite ranking of North American outdoor segments by commercial momentum entering 2026.
The Fizel Outdoor Commerce Index scores nine segments on four weighted inputs: participation base, revenue per customer, frequency of commercial interaction, and structural growth outlook. Scores are relative, not absolute, and are intended to rank momentum rather than size.
Nine segments scored on commercial momentum entering 2026.
- 01Marine88
Highest revenue per customer and long service relationships
- 02Camping, RV & outdoor stay85
Recurring bookings and strong add-on revenue
- 03Cycling81
Massive base plus recurring service demand
- 04Guides & outfitters78
Deposit-driven, high-margin experience revenue
- 05Rentals76
Converts price-sensitive demand into occasions
- 06Snow & resorts72
Pass economics de-risk a compressed season
- 07Powersports70
High-ticket sales with attached service
- 08Outdoor retail66
Broad demand, compressed margin
- 09Events & races61
Prepaid registrations, concentrated calendar
Fizel estimate. Composite of participation base (25%), revenue per customer (25%), interaction frequency (25%) and structural outlook (25%).
Source: Fizel Research.
Where Growth Comes From
Growth in the outdoor economy now comes from depth, not from discovery.
With participation at 59% and growing at 1.1%, the arithmetic of outdoor growth has changed. Incremental revenue must come from frequency, from attaching services to existing customers, and from capturing more of the journey each customer already takes.
| Growth lever | Relative impact | Time to effect |
|---|---|---|
| Increase frequency of existing customers | Highest | One to two seasons |
| Attach service, rental and repair | High | Immediate |
| Capture deposits and pre-bookings | High | Immediate |
| Memberships and passes | Moderate to high | One season |
| Acquire new participants | Lowest | Multi-year |
Relative assessment of growth levers available to a typical outdoor operator.
Source: Fizel Research analysis.
The 2030 Outlook
A trillion-dollar North American outdoor economy is plausible by 2030, on frequency, not on headcount.
Fizel Research models three scenarios for North American outdoor recreation value added through 2030. All three assume participation growth remains modest; the scenarios differ principally in frequency and spend per occasion.
| Scenario | 2030 value added | CAGR | Assumption |
|---|---|---|---|
| Conservative | $918B | 3.2% | Flat frequency, modest price growth |
| Base case | $1.01T | 5.2% | Partial recovery in frequency |
| Accelerated | $1.09T | 6.8% | Frequency returns toward 2019 levels |
Fizel estimate. Scenarios are modeled from 2025 base value added of $785B with compounding applied through 2030.
Source: Fizel Research estimates.
- $1.01TNorth American outdoor value added, 2030 base caseFizel estimate
- 5.2%Base-case compound annual growth, 2025 to 2030Fizel estimate
- 183MAdditional occasions from one extra outing per participantFizel estimate
Source: Fizel Research.
Conclusion
The outdoor economy has won the argument for participation. Its next decade depends on operations.
Three in five Americans now participate in outdoor recreation. The category is mainstream, the economy is measured in hundreds of billions, and the experience side has overtaken the product side. What has not kept pace is frequency.
That makes the operational layer, booking, deposits, check-in, service, resale, funding and rebooking, the industry's most under-used growth asset. Every one of those moments is a payment moment, and every payment moment is either friction or a reason to come back.
Methodology And Sources
How this report was built, what is reported and what is modeled.
This report combines published economic and industry data with Fizel Research modeling. Reported figures are attributed to their source and data year. Modeled figures are labelled as Fizel estimates and are derived from published aggregates, segment composition, operator revenue mix and payment-behaviour analysis.
| Source | Used for | Data year |
|---|---|---|
| U.S. Bureau of Economic Analysis, Outdoor Recreation Satellite Account | U.S. value added, industry composition, GDP share | 2024 |
| Outdoor Industry Association | Participation base and participation rate | 2025 |
| National Marine Manufacturers Association | U.S. recreational marine spending | 2025 |
| PeopleForBikes | U.S. cycling participation | 2024 |
| Statistics Canada | Canadian skiing facility operating revenue | 2024 |
| Fizel Research | Canadian value added, 2025 estimates, segment splits, index and 2030 scenarios | 2025 to 2030E |
This report is provided for informational purposes only and does not constitute financial, investment or legal advice. Estimates labelled as Fizel Research figures are modeled and subject to revision. © 2026 Fizel. The Outdoor Economy 2026, North American Consumer, Commerce & Participation Intelligence Report.