The cleanest U.S. employer benchmark is US$2.290405 billion in 2022 revenue for Recreational Goods Rental. Newer official evidence shows 12,770 nonemployer establishments in 2024 and 18,907 private-sector jobs on an annual-average basis in 2025. Canada offers useful location counts, but its closest rental code is too broad to measure outdoor rentals alone.
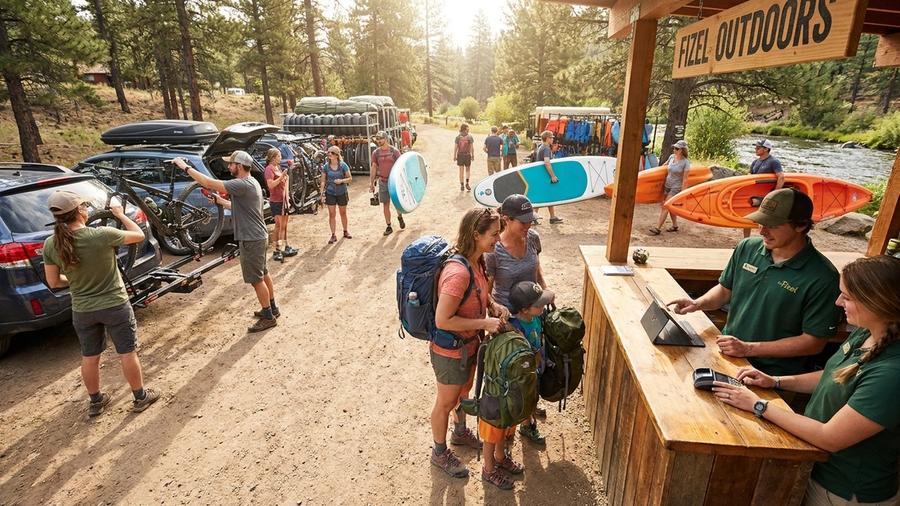
That separation matters at a real rental counter. A stand-alone kayak fleet, a ski department inside a resort and a bike shop that also rents bikes can serve the same visitor while appearing in different industries. Official rental statistics measure classified establishments, not every place a guest can borrow equipment.
What counts as outdoor equipment rental
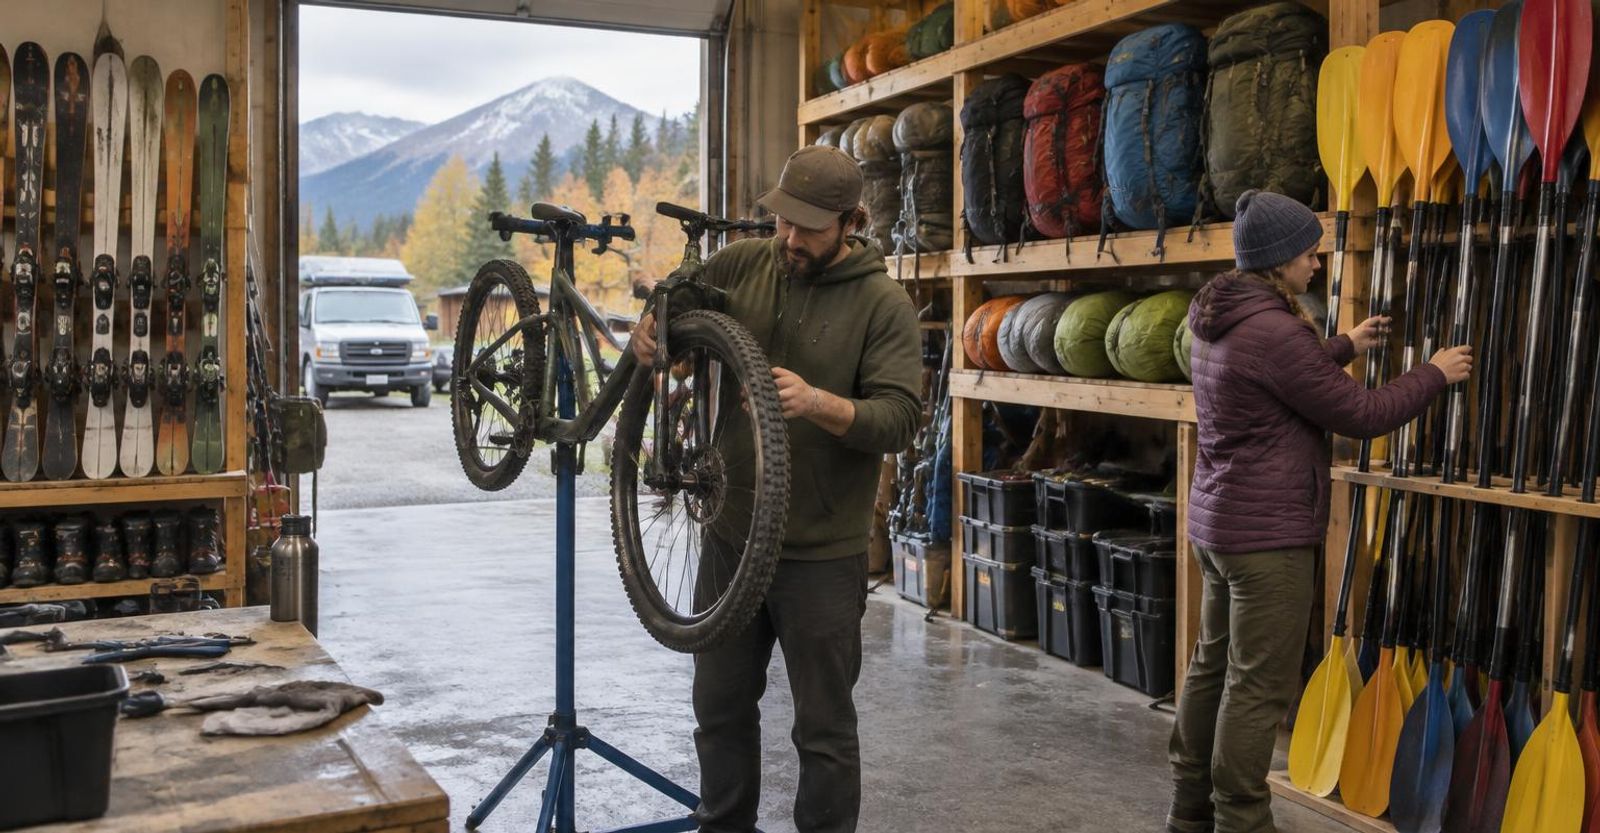
The 2022 U.S. NAICS Manual, code 532284 defines establishments primarily renting recreational goods, including bicycles, canoes, motorcycles, skis, sailboats, beach chairs and beach umbrellas. Canada's 2022 definition for 532280 is wider: establishments primarily renting consumer goods not classified elsewhere, including recreation equipment and several household or event categories.
| Operation | Measured coverage | Important gap |
|---|---|---|
| Stand-alone recreational rental establishment | U.S. 532284 if recreational rental is the primary activity; Canada 532280 where applicable | Codes do not identify individual equipment fleets or rental days. |
| Retail shop with a rental department | Usually classified under the shop's primary retail activity | Retail rental revenue is not automatically part of 532284. |
| Resort, marina, campground or accommodation rental desk | Usually follows the establishment's primary activity | A busy desk may not appear as a rental establishment. |
| Guide or outfitter lending equipment with a trip | Usually follows the primary tour or guide activity | Included gear is not separately measured as a rental transaction. |
| Canadian furniture, musical instrument or party rental business | May fall within 532280 alongside recreation equipment | The Canadian count cannot be described as outdoor-only. |
Fizel Research classification interpretation, not a survey of rental operations. Geography: United States and Canada. Units: coverage categories, not operator counts.
Sources: U.S. 2022 NAICS Manual and NAICS Canada 2022, cited above.
U.S. employer footprint and economics
The 2022 Economic Census EC2253BASIC source file records 2,633 firms, 2,813 establishments and 18,227 employees in U.S. 532284. Sales, value of shipments, or revenue were US$2.290405 billion; annual payroll was US$683.596 million. A firm can operate more than one establishment, so these counts answer different questions.
| Published measure | Exact value | Source field and unit |
|---|---|---|
| Firms | 2,633 | FIRM: Number of firms |
| Establishments | 2,813 | ESTAB: Number of establishments |
| Employees | 18,227 | EMP: Number of employees; reference-period headcount, not annual-average jobs or FTEs |
| Sales, value of shipments, or revenue | US$2,290,405,000 | RCPTOT: 2,290,405 in US$1,000 |
| Annual payroll | US$683,596,000 | PAYANN: 683,596 in US$1,000 |
United States, NAICS 532284, 2022. All five selected published values have blank suppression flags.
U.S. Census Bureau, EC2253BASIC, regular BASIC file, not First Look.
A comparison of revenue allocation, not a profit-margin estimate. The remainder includes operating costs and any operating surplus.
- Annual payroll / revenue29.8%
US$683,596,000 / US$2,290,405,000 × 100
- Revenue less annual payroll / revenue70.2%
Not profit: equipment, premises, insurance, maintenance and other costs remain.
Percent of 2022 revenue, United States
Fizel Research calculations from the 2022 Economic CensusExact payroll and revenue inputs are in the adjacent employer table. Payroll share is rounded to one decimal.
U.S. Census Bureau, EC2253BASIC, NAICS 532284.
Fizel Research calculates revenue per employer establishment of approximately US$814,221: US$2,290,405,000 / 2,813. Annual payroll is 29.8% of revenue, and the reference-period employee count is 6.48 per establishment: 18,227 / 2,813. These are sector ratios, not the results of a typical shop. They say nothing about fleet depreciation, insurance, maintenance, rent or owner income.
U.S. nonemployer businesses and the 2024 revenue comparison
The 2024 Nonemployer Statistics original file reports 12,770 nonemployer establishments and US$467.443 million in receipts for 532284. The series covers businesses with no paid employees, subject to federal income tax and meeting the program's receipt threshold. It is not a count of rental employees or informal equipment lending. Census released the 2024 products on September 29, 2026.
A same-year revenue comparison is available in AIES00NONEMP for 2024. Its employer revenue field is US$2.146363 billion, not total employer-plus-nonemployer revenue. The nonemployer field is US$467.443 million. The AIES-NES methodology backward-converts nonemployer records to NAICS 2017; the matching 532284 label and nonemployer receipts support this comparison. Employer revenue is an estimate with a 10.9% coefficient of variation, so the resulting share is not an exact census partition.
| Measure | Value | Meaning |
|---|---|---|
| Nonemployer establishments | 12,770 | NES NESTAB, all legal forms and receipt sizes |
| Nonemployer receipts | US$467,443,000 | NES NRCPTOT; AIES RCPT_TOT_VAL_NS matches |
| Employer revenue estimate | US$2,146,363,000 | AIES RCPT_TOT_VAL; coefficient of variation 10.9% |
| Combined same-year revenue inputs | US$2,613,806,000 | Fizel calculation: 2,146,363,000 + 467,443,000; U.S. measured code only |
| Nonemployer share of combined revenue inputs | 17.9% | Fizel calculation: 467,443,000 / 2,613,806,000 × 100 |
| Receipts per nonemployer establishment | Approximately US$36,605 | Fizel calculation: 467,443,000 / 12,770; not income or profit |
United States, 2024, 532284. AIES uses NAICS 2017; NES uses NAICS 2022. Do not combine 2022 employer counts with 2024 nonemployer counts to claim a same-year business share.
Receipt data include disclosure protection. Blank numeric noise-range fields do not mean no noise.
U.S. Census Bureau, NS00NONEMP and AIES00NONEMP original data and field layouts.
The central nonemployer revenue share is useful for understanding structure, but its denominator contains estimated employer revenue. As a descriptive sensitivity check, moving that employer estimate by one reported coefficient of variation, 10.9%, changes the share to approximately 16.4% to 19.6%. This is not a confidence interval and does not model nonemployer disclosure noise. No employer/nonemployer business-count share is calculated because these verified inputs do not provide comparable same-year employer counts.
| State | Nonemployer establishments | Receipts, US$ |
|---|---|---|
| Florida | 1,874 | 100,859,000 |
| Texas | 1,450 | 49,578,000 |
| California | 1,396 | 47,700,000 |
| Michigan | 446 | 13,430,000 |
| Georgia | 437 | 16,281,000 |
Ranked by NESTAB, not receipts. All legal forms and receipt-size classes; NRCPTOT monetary fields multiplied by 1,000. These five states' count and receipt flags are blank.
2024 U.S. Census Nonemployer Statistics, NS00NONEMP, original state records.
Seasonality: employment nearly doubles from January to July
Final 2025 QCEW private-sector data record 3,282 annual-average establishments, 18,907 annual-average jobs and US$785,358,408 in annual wages for 532284. Average annual pay was US$41,538. The BLS finalization schedule places the final 2025 data with the August 28, 2026 release. QCEW measures unemployment-insurance-covered employment, not nonemployers, and counts jobs rather than unique people or full-time equivalents.
Private NAICS 532284. All 12 national monthly employment observations are disclosed. The mean of those observations equals 100.
- Jan75.4
- Feb76.0
- Mar81.8
- Apr88.9
- May108.5
- Jun134.6
- Jul143.6
- Aug135.1
- Sep108.8
- Oct91.4
- Nov77.1
- Dec78.9
Index: 12-month employment mean = 100; United States, 2025
Fizel Research calculation from final BLS QCEW quarterly filesObserved within-year variation, not a seasonally adjusted or multiyear seasonal estimate. Raw monthly values and formula follow.
BLS QCEW 2025 quarterly industry CSVs, private ownership code 5.
| Month | Jobs | Index, mean = 100 |
|---|---|---|
| January | 14,254 | 75.4 |
| February | 14,378 | 76.0 |
| March | 15,460 | 81.8 |
| April | 16,810 | 88.9 |
| May | 20,507 | 108.5 |
| June | 25,440 | 134.6 |
| July | 27,155 | 143.6 |
| August | 25,534 | 135.1 |
| September | 20,568 | 108.8 |
| October | 17,284 | 91.4 |
| November | 14,581 | 77.1 |
| December | 14,911 | 78.9 |
Fizel calculation: index = monthly jobs / (226,882 / 12) × 100. The exact monthly mean is 18,906.8333; BLS rounds its annual-average employment to 18,907.
BLS QCEW 2025 Q1 through Q4, U.S. private 532284.
July's 27,155 jobs were 90.5% above January's 14,254: (27,155 / 14,254 - 1) × 100. This national pattern is summer-heavy across the whole code. It should not be applied mechanically to a winter ski shop or treated as a monthly rental-revenue curve. Operators still need their own booking dates, pickup dates, fleet utilization and staffing records.
State concentration: Florida leads both measures
Annual-average private jobs in NAICS 532284 divided by the published national total of 18,907.
- Florida20.0%
- California14.0%
- New York7.1%
- Texas5.1%
- Colorado5.0%
Share of U.S. private-sector jobs, 2025, percent
Fizel Research calculations from final BLS QCEWTogether: 9,681 / 18,907 × 100 = 51.2%. Exact jobs and a separate establishment ranking appear below.
BLS QCEW 2025 annual industry file, 532284.
| State | Establishments | U.S. share |
|---|---|---|
| Florida | 574 | 17.5% |
| California | 358 | 10.9% |
| Texas | 198 | 6.0% |
| Colorado | 131 | 4.0% |
| North Carolina | 114 | 3.5% |
Fizel calculations: each count / 3,282 × 100. Top-five total: 1,375 / 3,282 × 100 = 41.9%.
Final BLS QCEW, private 532284, 2025.
| State | Annual-average jobs | U.S. share |
|---|---|---|
| Florida | 3,783 | 20.0% |
| California | 2,648 | 14.0% |
| New York | 1,348 | 7.1% |
| Texas | 962 | 5.1% |
| Colorado | 940 | 5.0% |
Fizel calculations use the published U.S. denominator, not a sum of disclosed state employment. The employment top five differs from the establishment top five.
Final BLS QCEW, private 532284, 2025.
Employment is suppressed for the District of Columbia, Iowa, Mississippi, North Dakota, Rhode Island, South Dakota, Vermont, West Virginia and Wyoming. Their zero placeholders are not zero jobs. The national total less disclosed 50-state/DC employment is 270, below fifth-ranked Colorado's 940, so suppressed jurisdictions cannot displace this top five. This residual is a bound, not an estimate for any state. Puerto Rico and the Virgin Islands are excluded from the state rankings.
Canada: a broader consumer-rental location series
Statistics Canada's June 2026 Business Counts show 688 locations with employees and 1,165 without employees for 532280. Furniture, party supplies and other consumer rentals are included alongside recreation gear. The arithmetic combined count of 1,853 describes this broad measured code, not 1,853 outdoor rental companies.
NAICS Canada 532280, not outdoor-only. Locations with and without employees remain distinct published measures.
- With employees688
- Without employees1,165
Statistical locations, Canada, June 2026
Statistics Canada, Tables 33-10-1174-01 and 33-10-1175-01Not unique firms. Employer share of combined measured locations: 688 / (688 + 1,165) × 100 = 37.1%, a Fizel calculation.
June 2026 Business Counts, released August 14, 2026.
These counts include non-outdoor consumer rentals. Employer share is a Fizel calculation within each geography, not a share of outdoor operators.
| Geography | With employees | Without employees | Employer share |
|---|---|---|---|
| Canada | 688 | 1,165 | 37.1% |
| Newfoundland and Labrador | 7 | 12 | 36.8% |
| Prince Edward Island | 1 | 5 | 16.7% |
| Nova Scotia | 13 | 18 | 41.9% |
| New Brunswick | 9 | 17 | 34.6% |
| Quebec | 137 | 275 | 33.3% |
| Ontario | 241 | 415 | 36.7% |
| Manitoba | 21 | 29 | 42.0% |
| Saskatchewan | 17 | 23 | 42.5% |
| Alberta | 63 | 152 | 29.3% |
| British Columbia | 176 | 215 | 45.0% |
| Yukon | 2 | 2 | 50.0% |
| Northwest Territories | 1 | 1 | 50.0% |
| Nunavut | No published total row | 1 | Not calculated |
Fizel formula: with-employees locations / (with-employees + without-employees locations) × 100. Nunavut's absent employer row is not silently converted into a published zero.
The counts are locations, not firms. Do not sum employment-size bands into total employees.
Statistics Canada full CSVs 33101174 and 33101175, NAICS Canada 2022, code 532280.
Ontario, Quebec and British Columbia together hold 1,459 of the 1,853 combined measured locations, or 78.7%. Adding Alberta produces 1,674, or 90.3%. Fizel calculates these shares from the province counts above. They show geographic concentration within a broad consumer-rental code, not the provincial distribution of outdoor rental revenue.
Reference-period verification matters here. The CSV's January 2026 label is the normalized semi-annual date. The Statistics Canada Web Data Service distinguishes normalized refPer from raw refPerRaw: all 27 available selected national/provincial observations report June 30, 2026 as the raw date. The August 14 release also confirms the June snapshot. These are June counts, not a substituted January series.
The employer series covers active locations with employees. Without-employees locations must be active and have revenue greater than C$30,000 or be incorporated, under the published notes. A company with several locations can be counted several times. Statistics Canada cautions against treating these products as a straightforward growth series because classification and methodological changes can alter counts.
Rental categories and the customer base beside them
| Category | Typical rental format | Code coverage and gap |
|---|---|---|
| Ski and snow | Daily packages, demo equipment, season leases | Skis are explicit in U.S. 532284; resort and retail departments can be classified elsewhere. No published fleet or rental-incidence measure here. |
| Bikes | Hourly or daily bikes, destination delivery, multi-day touring | Bicycles are explicit in U.S. 532284; retail bike-shop rentals can sit outside the code. |
| Paddlesports and boats | Canoes, kayaks, paddleboards, pleasure boats | Canoes and sailboats are explicit U.S. examples; Canada's broader code includes pleasure boats. Marina or outfitter activity may be classified elsewhere. |
| Camping, hiking and climbing | Tents, packs, camping kits, technical gear | Recreation-equipment classification depends on the establishment's primary activity. Guided-trip equipment and retail rentals are not comprehensively separated. |
| Beach and water equipment | Chairs, umbrellas and recreational water gear | Beach chairs and umbrellas are explicit U.S. examples. Accommodation or mixed rental-centre activity can be outside the measured core. |
Fizel Research classification and operating-format interpretation. Geography: United States and Canada; reviewed October 31, 2026. No category operator counts or rental penetration are inferred.
U.S. 2022 NAICS Manual; NAICS Canada 2022, 532280.
| Audience and definition | Participants | Reference year |
|---|---|---|
| Outdoor participants, population age 6+ | 183.2 million; 59% of age 6+ population | 2025 |
| Hikers, population age 6+ | 63.4 million | 2024 |
| Vehicle-accessible campers | 42.3 million | 2025 |
| Paddlers | More than 34 million | 2025 |
| Recreational kayakers | 15.3 million | 2025 |
| Canoeists | 10.2 million | 2025 |
United States, OIA 2026 report editions. The hiking reference year is 2024, not 2025. No rental-incidence calculation is made.
Outdoor Industry Association public participation, hiking, camping and paddlesports summaries; full links in Sources.
For category context, use Fizel's ski participation and resort research, the 47-resort terrain comparison and camping participation and campground benchmarks. These describe adjacent demand and destinations. None establishes how many guests rented equipment.
What the official data miss
This official-code benchmark is different from Fizel's broader outdoor-business population model, which includes a separately labelled rental estimate. The model and the official series have different scopes and counting units; neither validates the other's rental total.
The verified sources do not provide a comprehensive outdoor-only Canadian revenue figure, total North American rental revenue, rental penetration by activity, fleet utilization, rental days, average rental ticket or product-level market shares. They also do not isolate rentals bundled into a guided trip or lodging package. No missing value is projected into 2026. No inflation-adjusted trend or cross-country total is constructed.
Operator implications: use the benchmark, keep your own calendar
The employment curve is a useful reminder to separate the quiet-month base from the peak-day crew. It is not a staffing prescription. A coastal boat fleet, a mountain bike shop and a ski rental department face different weather, transport, fitting and maintenance demands. Compare your own rental days, fleet availability and pickup queues with your local season before changing labour or inventory plans.
For the business systems around that calendar, start with Fizel's outdoor equipment rental payments page. The practical equipment-rental payment guide follows reservations through returns; the ski rental deposits and damage-holds guide addresses disclosures and records. If you are evaluating processing costs across a busy and a quiet month, a statement analysis works from your actual statements, not these sector averages.
Methodology and reproducible calculations
Sources
All sources accessed and checked October 31, 2026. Report edition dates do not replace data reference years. Original downloadable files, not search snippets, support the numerical benchmarks.
2022 Economic Census EC2253BASIC table; original BASIC data, field layout and README archive.
2024 Nonemployer Statistics NS00NONEMP table; original NES data archive. Released September 29, 2026.
2024 AIES-NES AIES00NONEMP table; original data archive; 2024 methodology and classification conversion.
BLS QCEW 2025 annual original industry CSV; monthly inputs from Q1, Q2, Q3 and Q4. Final 2025 private-sector data.
Statistics Canada June 2026 with-employees full CSV and notes; without-employees full CSV and notes; NAICS Canada 2022, 532280 definition. Business Counts released August 14, 2026.
Outdoor Industry Association 2026 public summaries: participation, hiking, camping and paddlesports. Reference years and audience definitions appear in the demand table; no gated full-report access is implied.
BLS release calendar and finalization rule; Statistics Canada WDS normalized/raw date definitions; June 2026 Business Counts release; Census September 29, 2026 NES and AIES-NES release confirmation. Accessed October 31, 2026.