
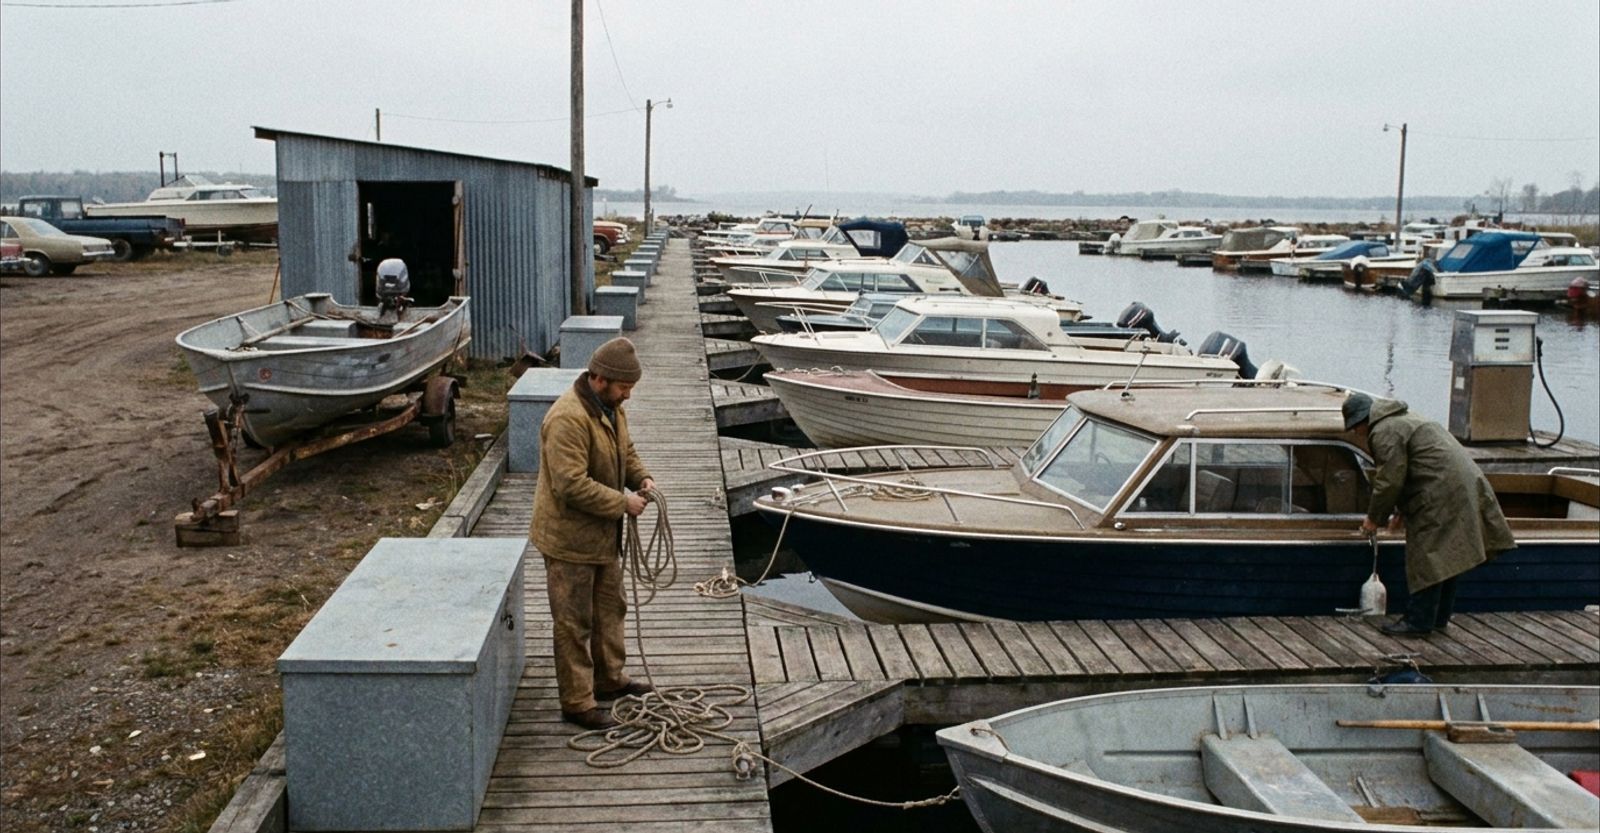
Recreational boating is one of the few parts of the outdoor economy where the customer relationship lasts for years rather than a weekend. A boat is bought, financed, insured, fuelled, stored, launched, repaired, upgraded and eventually resold, and most of that money moves through marinas, dealers, boatyards, rental fleets and charter operators.
The 2025 data shows a market that cooled at the showroom while holding up almost everywhere else. New boat unit sales fell for a second straight year, yet total retail marine spending slipped only modestly, because fuel, docking, maintenance, accessories, insurance and used boat transactions are tied to an installed fleet of roughly 11.7 million registered vessels rather than to this year's showroom traffic.
This report pulls together the most recent public United States and Canadian data available in September 2026. Reported figures carry their source. Where current-year numbers have not been published, Fizel Research estimates are labelled and the arithmetic behind them is shown. United States and Canadian measures are kept separate, because they are built on different definitions, different currencies and different collection methods.
Covers new and pre-owned boats, engines, trailers, accessories, fuel, financing, insurance, docking and maintenance. It is a retail spending measure, not value added and not total economic impact.
NMMA, US Recreational Marine Spending Reached $54B in 2025, July 2026.
Boating at a glance
The headline figures, each labelled by country and by source. Fizel Research calculations and estimates are marked wherever they appear.
- $54BUS retail marine spending, 2025NMMA, 2026
- $38.4BUS value added, boating and fishing combined, 2024Bureau of Economic Analysis, 2026
- 11,674,073US registered recreational vessels, 2024US Coast Guard, 2025
- 215,237New boats sold at US retail, 2025NMMA, 2026
- 867,059Pre-owned boats sold in the US, 2025NMMA, 2026
- $12.1BUS aftermarket accessories spending, 2025NMMA, 2026
- 12M+Canadian adults who boat each yearTransport Canada, 2026
- 921Marinas in Canada, December 2025Statistics Canada, 2026
- C$13.9BCanadian recreational boating economic impactNMMA Canada, 2025
National Marine Manufacturers Association, NMMA Canada, US Bureau of Economic Analysis, US Coast Guard, Transport Canada and Statistics Canada. Figures are reported in their original currency and are not summed across countries.
Two 2026 figures in this report are Fizel Research estimates rather than published statistics: roughly $54 billion in US retail marine spending, and a US registered fleet of roughly 11.7 million vessels. Both are derived in the methodology section and should be treated as planning benchmarks until full-year 2026 data is released.
Reported figures come from the National Marine Manufacturers Association, NMMA Canada, the US Bureau of Economic Analysis, the US Coast Guard, Transport Canada and Statistics Canada. Every figure is labelled United States or Canada. United States dollars and Canadian dollars are never combined, and no single North American market total is constructed from measures built on different definitions.
Three numbers that are often confused
$38.4 billion, $54 billion and headline economic impact figures describe different things. Mixing them is the most common error in boating coverage.
The Bureau of Economic Analysis reported that the US outdoor recreation economy generated $696.7 billion in value added in 2024, or 2.4% of GDP. Within that, boating and fishing was the largest conventional outdoor activity at $38.4 billion in current-dollar value added, and the largest conventional activity in 34 states.
Value added is not retail spending. It measures the contribution of production to GDP, net of the inputs consumed along the way, and the BEA figure combines boating with fishing, so it cannot be read as a boating-only sales number. NMMA's $54 billion, by contrast, is what Americans actually spent at retail on boats, engines, trailers, accessories, fuel, financing, insurance, docking and maintenance in 2025.
Three commonly quoted figures, three different definitions. Use the one that matches the question being asked.
Boating and fishing combined, measured as the contribution to US GDP after subtracting intermediate inputs.
- Combined activity, not boating alone
- National accounts methodology
- Comparable with other GDP measures
What buyers spent across the US marine market in a single year, from hulls to slip fees.
- Boating specific
- Includes services and pre-owned transactions
- Not comparable with value added
Impact estimates apply multipliers to direct activity and are built on assumptions that vary by study.
- Always check the year and method
- Never mix with GDP measures
- Not used as a headline in this report
Fizel Research summary of published definitions, September 2026.
For operators, the practical version is simpler. Value added tells you how boating compares with other parts of the economy. Retail spending tells you how much money is moving through marine businesses, and it is the number that maps onto slips, service bays, parts counters and rental desks.
The 2025 reset: spending held while new boat units fell
Unit sales dropped 8.8%. Total retail marine spending slipped about 2.9%. The gap says most of the market is not the showroom.
NMMA reported 215,237 new boats sold at US retail in 2025, down 8.8% from 236,070 in 2024, with freshwater fishing boats holding up better than the average at a 1.5% decline. Over the same period, total US retail marine spending moved from $55.6 billion in 2024 to $54 billion in 2025. Fizel Research calculates that as a decline of about 2.9%, using those two published totals.
A new boat is a large, financeable, deferrable purchase, so it reacts quickly to rates and confidence. Fuel, storage, insurance, service and accessories do not. Aftermarket accessories alone accounted for $12.1 billion of 2025 spending, which is more than the entire reported value of the pre-owned boat market.
Reported NMMA totals alongside a clearly labelled Fizel Research estimate for 2026. The estimate is not an NMMA forecast.
| Year | US retail marine spending | Change | Basis |
|---|---|---|---|
| 2024 | $55.6B | -2.6% vs 2023 | Reported, NMMA |
| 2025 | $54.0B | About -2.9% vs 2024 (Fizel Research calculation) | Reported, NMMA |
| 2026 | About $54.0B (range $52.5B to $56.5B) | Assumed flat nominal, range -3% to +5% | Fizel Research estimate |
Fizel Research estimate for 2026, built on NMMA reported totals for 2024 and 2025.
The 2026 row is an estimate produced by Fizel Research and should not be attributed to NMMA.
NMMA, 2025 and 2026 spending releases. 2026 figure is a Fizel Research estimate.
The estimate assumes flat nominal spending in 2026. Soft new-boat demand pulls down, while the large installed fleet and resilient fuel, docking, maintenance and accessories spending push back. The range allows for a further 3% decline if unit sales keep sliding, or a 5% gain if replacement demand and pricing recover together.
The used market carries the volume
For every new boat sold at US retail in 2025, roughly four pre-owned boats changed hands.
NMMA reported that new boats represented 20.3% of boat unit sales in 2025 and pre-owned boats 79.7%.
- Pre-owned79.7%
- New20.3%
Fizel Research calculates a pre-owned to new ratio of about 3.9 to 1 (79.7 divided by 20.3). This is a ratio of reported unit shares, not of price or revenue.
NMMA, US Recreational Marine Spending Reached $54B in 2025, July 2026.
NMMA reported 867,059 pre-owned boat sales in 2025, worth $10.8 billion, with pre-owned outboard boats leading unit volume. Set against 215,237 new units, the used market is where most transactions, most trade-ins and most first-time buyers sit, and it feeds directly into the service, storage and parts businesses that inherit those boats.
For dealers, the mix matters more than the headline. A pre-owned unit brings lower ticket revenue, a higher proportion of cash and financed private-party activity, and a stronger tie to service work. Volume is concentrated in used inventory even when showroom traffic is quiet, which is why dealer cash flow often looks steadier than new-boat statistics suggest.
The registered fleet and what it does not count
11.67 million registered vessels in 2024, 93.0% of them mechanically propelled.
Annual registration totals reported by the US Coast Guard. The series peaked in 2021, dipped through 2023 and recovered 1.1% in 2024.
- 202011,838,188
- 202111,957,886
- 202211,770,383
- 202311,546,512
- 202411,674,073+1.1% year over year
millions of vessels
Reported data, US Coast GuardRegistration counts depend on state rules, which change over time and differ in how they treat non-motorized craft.
US Coast Guard, Recreational Boating Statistics 2024.
The fleet has been stable rather than flat. Five years of data sit inside a band of roughly 400,000 vessels, with the 2021 peak reflecting pandemic-era buying and the 2023 low partly reflecting state registration cycles and deregistrations rather than a collapse in boat ownership.
Of 11,674,073 registered vessels, 10,852,992 were mechanically propelled and 821,081 were not.
- Mechanically propelled10,852,992
- Paddlecraft628,507
- Sailboats81,783
- Other non-mechanical74,501
- Rowboats36,290
Fizel Research calculates the mechanically propelled share at about 93.0% and the non-mechanical share at about 7.0%. Most states do not require paddlecraft registration, so paddlecraft are heavily undercounted here.
US Coast Guard, Recreational Boating Statistics 2024. Share calculation by Fizel Research.
Registrations are an ownership signal, not a participation measure. They count vessels that a state requires to be registered, which in most states means motorized craft. Canoes, kayaks and paddleboards rarely appear, so the 628,507 registered paddlecraft represent a small slice of actual paddling activity. Anyone sizing paddlesports from this table will understate it badly.
Canada: participation, infrastructure and the limits of comparison
Four different Canadian measures, four different units. None of them converts cleanly into the others.
Transport Canada states that more than 12 million Canadian adults take part in recreational boating each year. Statistics Canada, asking a different question, found that 10% of Canadian households reported boating, sailing, canoeing, kayaking, rafting, rowing, dragon boating or seadooing close to home in 2023, with New Brunswick and Nova Scotia at 15% and British Columbia at 14%.
Those two numbers are not versions of the same statistic. One counts adults who boat anywhere over a year, the other counts households reporting a close-to-home activity in a specific survey year. Both are useful, and neither should be presented as the Canadian participation rate.
Each row is a different measure from a different source. They are shown side by side for reference and cannot be added together or converted into one another.
| Measure | Value | Unit | Source and year |
|---|---|---|---|
| Adults who boat annually | More than 12 million | Adults | Transport Canada, 2026 |
| Households boating close to home | 10% of households | Households, 2023 reference year | Statistics Canada, 2026 |
| Domestic person-trips involving boating | 8.6 million | Person-trips, 2023 | Statistics Canada, 2024 |
| Domestic person-trips involving canoeing or kayaking | 8.0 million | Person-trips, 2023 | Statistics Canada, 2024 |
| Marinas in Canada | 921 | Businesses, December 2025 | Statistics Canada, 2026 |
| Pleasure craft operator cards issued | About 162,300 | Cards issued in 2024, up 2.2% | NMMA Canada, 2025 |
| Annual economic impact | C$13.9 billion and 80,500 jobs | Impact estimate | NMMA Canada, 2025 |
Units differ by row. Person-trips count trips rather than unique participants, and activity categories can overlap.
These measures must not be summed, averaged or compared directly with United States figures.
Transport Canada, Statistics Canada and NMMA Canada.
On the business side, NMMA Canada puts the annual economic impact of Canadian recreational boating at C$13.9 billion and 80,500 jobs, and reports nearly C$1.1 billion in annual imports of American-built boats and engines. That import figure is worth noting for dealers on both sides of the border, because it means Canadian inventory costs are exposed to exchange rates and cross-border trade conditions in a way that service and storage revenue is not.
Operator cards are a useful leading indicator. NMMA Canada reported nearly 162,300 pleasure craft operator cards issued in 2024, up 2.2%. That counts cards issued during the year, not the full population of licensed boaters, but a rising issue rate points to new entrants rather than a shrinking base.
Where the money concentrates
Florida leads on both value added and retail spending, and the top three states hold close to 28% of national boating and fishing value added.
BEA reported boating and fishing as the largest conventional outdoor recreation activity nationally at $38.4 billion in value added, and the largest in 34 states.
- Florida$4.4B
- California$3.3B
- Texas$3.0B
- All other states combinedAbout $27.7B
US$ billions, current dollars
Reported data, Bureau of Economic AnalysisFizel Research calculates the top three states at about 27.9% of national boating and fishing value added ((4.4 + 3.3 + 3.0) divided by 38.4). Source figures are rounded, so the share is approximate.
BEA, Outdoor Recreation Economic Statistics, US and States, 2024, released March 2026.
The retail picture points the same way. NMMA reported Florida as the top state for marine spending in 2025, followed by Texas, Michigan, North Carolina and New York. Warm-water states dominate on volume, but the presence of Michigan and New York shows how much revenue short northern seasons can still generate when the fleet is large enough.
Concentration has an operational meaning. In Florida and Texas, a marina competes on availability, service turnaround and convenience across a long season. In Michigan, New York or most of Canada, the same business has to earn a full year of revenue inside five or six months, which changes how deposits, storage contracts and off-season billing are structured.
Seasonality, measured through the only monthly national series
Reported incidents are a safety statistic, not a participation count, but they are the clearest monthly signal of on-water exposure.
The US Coast Guard recorded 3,887 reported incidents in 2024, resulting in 556 deaths, 2,170 injuries and about $88 million in property damage. This is incident data, not a measure of trips, participants or sales.
- Reported incidents, 2024
Fizel Research calculates that May through August contained 2,630 of 3,887 reported incidents, about 67.7% of the annual total. Read this as a seasonality signal for on-water exposure and staffing, not as a proxy for participation or revenue.
US Coast Guard, Recreational Boating Statistics 2024.
July alone accounted for 905 reported incidents, more than the whole of October through March combined. The curve is steeper than most seasonal outdoor businesses face, and it reinforces what marina and rental operators already know: the revenue year is short, the staffing peak is sharp, and the administrative work of deposits, waivers, billing and disputes lands in the same weeks as the busiest days on the water.
What the numbers mean for marine businesses
A soft new-boat market, a large used market and a stable fleet push revenue toward service, storage, rentals and parts.
Three conclusions follow from the data above. The installed fleet is the durable asset in this industry, not annual unit sales. Recurring revenue from slips, storage, insurance and maintenance is less cyclical than the showroom. And used boat transactions keep bringing customers into service bays, parts counters and dealer finance offices even in a soft year.
The same national data reads differently depending on the operation.
Slip and storage agreements, service work and fuel carry the year, with a heavy administrative load concentrated in a few months.
- Recurring seasonal billing
- Large service invoices
- Winter storage and spring commissioning
New unit demand is soft, but pre-owned turnover and the attached service and parts business remain active.
- High-ticket transactions
- Trade-ins and deposits
- Parts and accessories counter
Demand compresses into summer weekends, which raises the value of reliable online booking and clear deposit and damage policies.
- Advance deposits
- Security holds
- Cancellation and weather policy
Fizel Research reading of 2025 and 2024 reported data, September 2026.
Fizel works with each of these operations, and the detail by business type sits on the dedicated pages for marinas, boat dealers, boat rentals and charters and marina service and boatyards.
Payment implications of a boating revenue mix
High ticket values, deposits, recurring contracts and a compressed season make marine payment processing different from ordinary retail.
A marine business rarely has one payment pattern. In a single week a dealer might take a five-figure boat deposit, a card-present parts sale, a financed balance and a service invoice paid remotely. A marina bills seasonal slip contracts on a schedule, sells fuel at the dock, invoices repair work of very different sizes and processes rental or transient dockage from visitors who may be paying with a foreign card.
Two existing Fizel guides go into the operational detail: payment processing for marinas and payment processing for boat dealers. If the question is what a current processing arrangement actually costs across that mix, a statement analysis reads the fee lines directly rather than working from a quoted rate.
2026 outlook
Two labelled Fizel Research estimates, with the reasoning and the ranges attached.
Baseline is the 11,674,073 vessels the US Coast Guard reported for 2024. The 2020 to 2024 series is stable but choppy, so the central assumption is near-zero net change, with a planning range of 11.5 million to 11.9 million. Final 2025 registration data was not available at the time of writing.
Fizel Research, 2026, from US Coast Guard Recreational Boating Statistics 2024.
Fizel Research also estimates US retail marine spending of roughly $54 billion in 2026, with a range of $52.5 billion to $56.5 billion. The central case assumes flat nominal spending: continued softness in new boat units offset by an installed fleet that still needs fuel, dockage, insurance, parts and service.
Neither estimate is a forecast published by NMMA, the US Coast Guard or any other organization. Both are Fizel Research figures produced for planning purposes, and both should be replaced as soon as the relevant 2026 data is released. No Canadian retail spending estimate is offered here, because no defensible public baseline exists for it.
Sources
Every figure in this report traces back to one of the following public releases.
- Bureau of Economic Analysis, Outdoor Recreation Economic Statistics, US and States, 2024, released March 2026.
- US Coast Guard, Recreational Boating Statistics 2024.
- NMMA, US Recreational Marine Spending Reached $54B in 2025, July 2026.
- NMMA, Latest data shows retail boat sales softened in 2025, March 2026.
- NMMA, 2025 pre-owned boat market.
- NMMA, 2024 US recreational marine spending.
- Transport Canada, boating safety news release, May 2026.
- Statistics Canada, Tapping into the water data, July 2026.
- Statistics Canada, Water safety by the numbers, July 2024.
- NMMA Canada, Canadian recreational boating economic impact, February 2025.
- NMMA Canada, pleasure craft operator cards issued in 2024, July 2025.
Related Fizel Research: Fishing Industry Statistics 2026 covers angler participation and spending, and Camping Industry Statistics 2026 covers the camping and outdoor hospitality side of the same customer base.
Fizel Research, September 2026. Reported statistics are attributed to their publishing organization. Fizel Research calculations and estimates are labelled wherever they appear and are never presented as third-party data. This report will be updated when 2026 spending and registration data is published.